Overview of Excel
Excel is basically a spreadsheet that Microsoft developed for the different operating systems such as Windows, macOS, Android and iOS. It comes equipped with diverse functionalities such as calculation, graphing tools, pivot tables and a macro programming language called Visual Basic for Applications. It forms a part of Microsoft Office.
In the actual application, the world of business has embraced Excel as it is smooth, effective and flexible in the way it can be used. Nearly all major businesses make use of Excel in one way or the other. It suits any and every kind of business processes whether it’s sales, marketing or anything else. It’s such an integral part of businesses because it can be customized and it can produce effective results quite quickly without any specific technical expertise.
Since data is imported into Excel most of the times, it’s interesting how Excel itself can be used to carry out data analysis.
But before we go to data analysis, let’s understand what it entails…

- Scalable: Handle large-scale scraping needs with ease.
- Robust QA: Hybrid QA process for accurate data extraction.
- Uninterrupted Scraping: residential proxies that never get blocked while scraping.
What is data analysis?
While data is of vital importance and the world has become data-driven, data in the raw form is not quite useful. In order to use data to derive actionable intelligence, it needs to be inspected, cleansed and transformed. This kind of a process is what is called Data Analysis.
There is no single way to accomplish this. There are a variety of ways to carry out data analysis. These diverse ways of data analysis are used in different fields such as business, science and even social sciences. In fact, data analysis is something that contemporary business world thrives on. Data analysis is leveraged in order to glean business intelligence to drive business growth.
Data mining is also an exercise of data analysis but it focuses on discovering new knowledge for predictive rather than descriptive purposes. As far as statistical applications are concerned, data analysis can be bifurcated into descriptive statistics, exploratory data analysis (EDA) and confirmatory data analysis (CDA).
While EDA is all about identifying new features in the data, CDA endeavours to confirm or prove the existing hypotheses wrong.
Predictive analytics is an exercise of applying statistical models for predictive forecasting or classification. In order to extract and classify information from textual sources, text analytics, on the other hand, makes use of statistical, linguistic and structural techniques.
These are all variations of data analysis. Data integration is something that is needed prior to data analysis. Data analysis is also connected with data visualization and data dissemination. Sometime, people use the terms data analysis and data modeling interchangeably.
Why Excel for data analysis?
You know how navigating through data could be a nightmare in itself.
It’s quite tricky to explore and process data when you are looking at large chunks of data. Analyzing it could very well be a unique challenge. However, Excel can come to your rescue.
Excel contains functions that can process a large amount of data quite effectively and easily. While different tasks of data analysis could be tricky, Excel functions are quite easy and anybody can use them and analyze the data.
It’s not necessary either to remember all the functions. You can simply Google it and find out the function you need for data analysis tasks.
For the sheer speed, simplicity and accuracy of it, Excel is not just useful but imperative for data analysis. It can save your valuable time and effectively enable the data analysis without any hassle as well.
How to carry out data analysis with Excel?
You might wonder how data analysis actually works. Here’s an overview of the step-wise process of data analysis for you:
Specifying Data Requirements
In order to carry out effective data analysis, it is imperative to specify the data requirements right at the outset. Let’s say that the data pertains to population. If that be so, the specific variables such as age, income etc., need to be specified and obtained. The data obtained could be in the form of numbers or categories.
Data Collection
Once the variables are specified, the information regarding the variables needs to be collected. It can be collected from various sources and made available for further process. This data may not contain any insights in the present form. Therefore, it needs to be processed and cleaned.
Data Processing
The data that is collected needs to be organized for further analysis. This would entail structuring the data in a particular way so that it becomes compatible for various analysis tools. For instance, you may need to place the data in rows and columns in a table for further analysis either in a Spreadsheet or Statistical Application. You may even need to create a data model as well.
Data Cleaning
While the data may get organized, it may, however, be incomplete. It could still contain duplicate items. A few errors may also creep in. Data Cleaning is the way to correct these errors and make the data accurate. There are different ways to clean the data. Suppose it contains financial data, it will surely have totals. These totals can then be compared against authentic published data or some other parameters. In this way, the data can be cleaned.
Data Analysis
Once data passes through various phases such as processing and cleaning, it would be ready for data analysis. There are numerous techniques available for data analysis. Data visualization can also be used in order to project the data in a graphic format. Correlation or Regression Analysis which are well-known statistical models can also be used for data analysis.
Communication
While data analysis may seem like the last step of the process, the findings of data analysis need to be communicated in a structured way to the end users. The end users may want the findings in a particular format. This is where some of the techniques of data visualization such as table and charts can prove quite useful as they can communicate the message quite succinctly. Colour coding and other tools can help you simplify it and enable you to communicate the findings more effectively.
Process of Data Analysis with Excel:
When it comes to data analysis with Excel, here’s how you go about it:
- Data collection
- Data Cleaning
- Data Exploration (using Pivot Table)
- Data Visualization
Let’s get started…
Data Collection:
- In order to get started with data analysis, the first step is to collect information on the variables in a systematic way. This kind of a process will help us find answers to the important questions and assess the results.
- Data collection part is vital because it ensures the accuracy of the data so that decisions related to the data turn out to be valid.
- Data collection is also useful because you have a baseline with which you can measure and you also get a target where you aim at reaching.
- As regards Excel, it is possible for you to collect and import data from a diversity of data sources. Your data sources could be:
- Web Page
- Microsoft Access database
- Let’s look at the practical example as mentioned below to see how we can collect data from various sources:
1. Extracting Data from Web Page
- It is possible that you would need the data that is refreshed on a website.
- For doing so, you can effectively use different Excel features. For instance, you can import data from a table on a website into Excel using a feature called Excel Web Query.
Step-by-Step Process to Extract Data From Web Pages:
Step 1: Open a workbook with a blank worksheet in Excel.
Now, go to DATA tab on the Ribbon -> Click on From Web. You would be returned to the New Web Query dialog box as illustrated in screenshot given below.
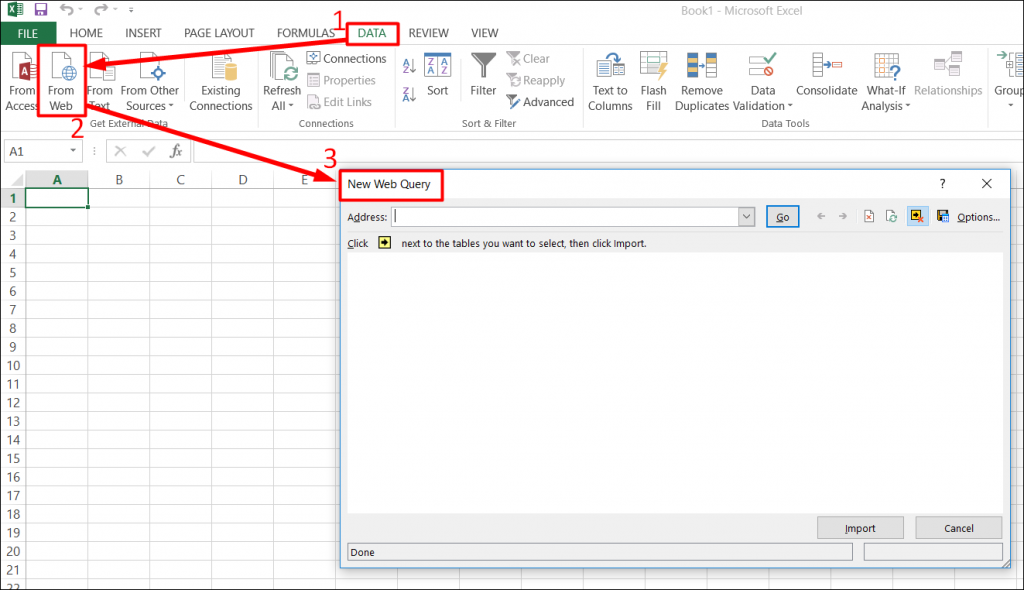
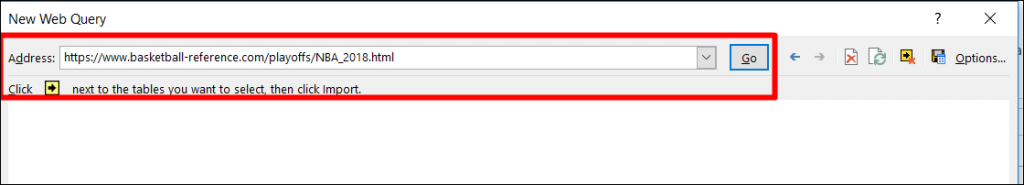
Step 2: Enter the URL of the website from where you want to import data, in the box next to Address and click Go.
In this example, we will extract data from the URL given below:
https://www.basketball-reference.com/playoffs/NBA_2018.html
Step 3: Click the yellow icons to select the data you want to import. Having done that, click the Import button after you have selected what you want.
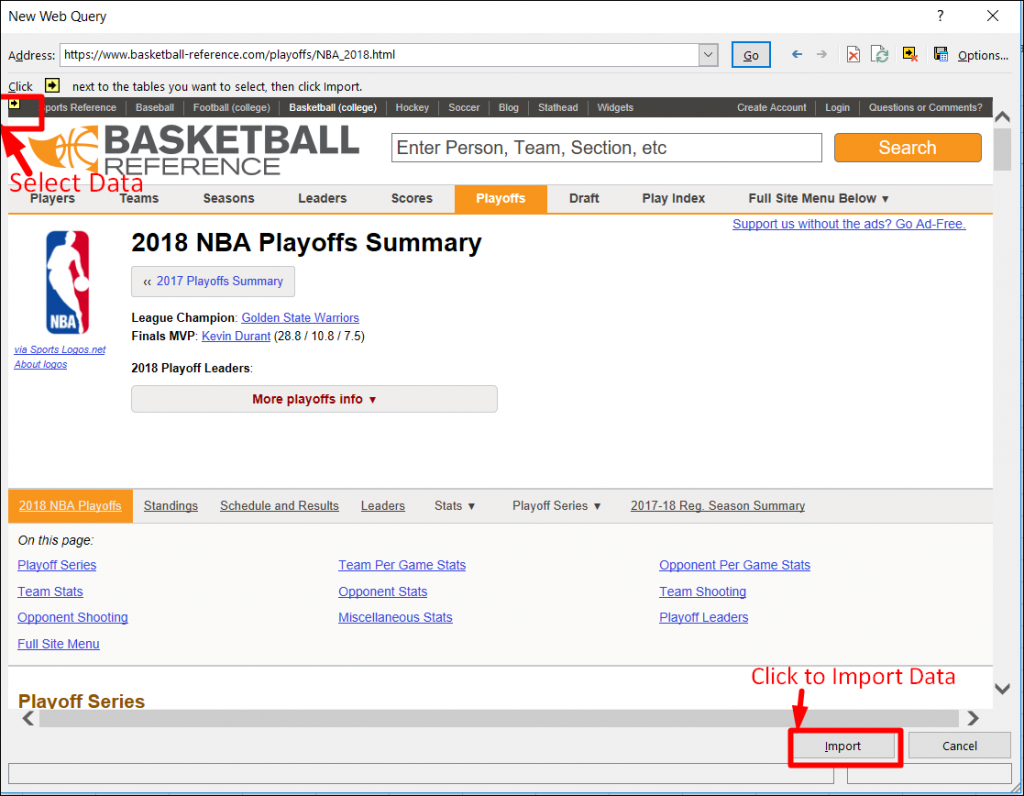
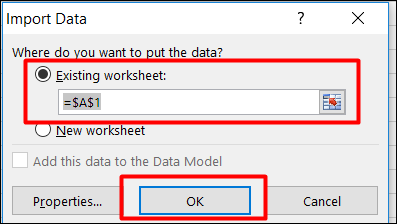
Step 4: Click Import data, specify where you want to put the data and click Ok. Arrange the data for further analysis and/or presentation.
Output:
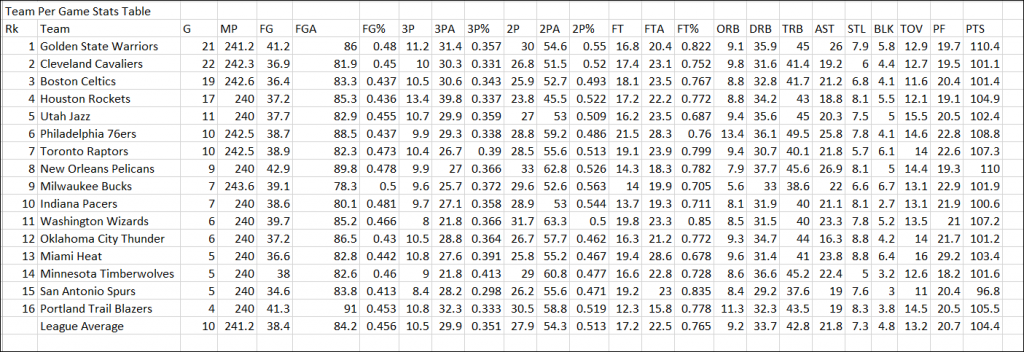
You can also collect data from other sources such as the following:
Data Cleaning
- Data cleaning is all about finding out and correcting the errors in the dataset. It also includes replacing the incomplete or inaccurate parts with the correct ones.
- In Excel, you can clean data by using the techniques given below:
- Removing duplicate values
- Removing spaces
- Merging and splitting columns
- Reconciling table data by joining or matching
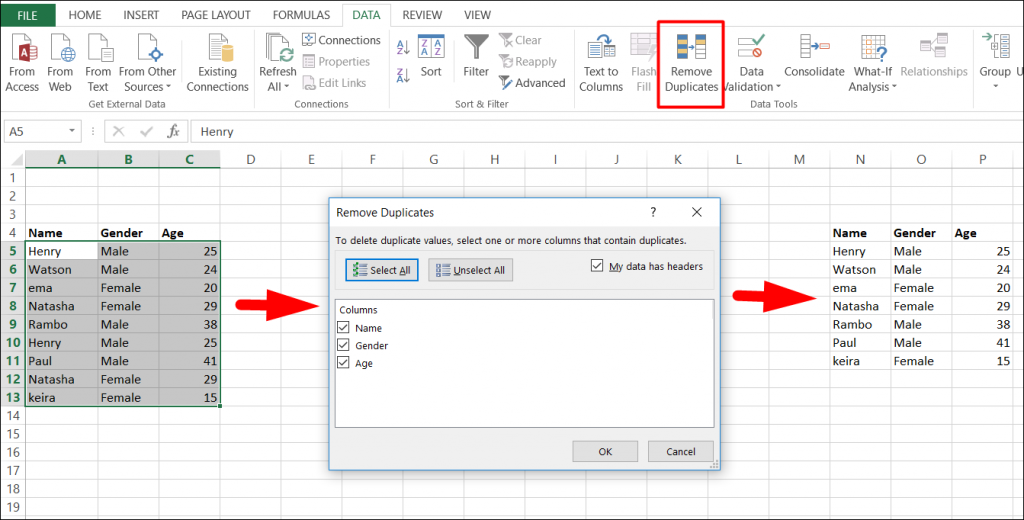
1. Removing duplicate rows:
- When you have large chunks of data, it is possible to have some duplicate rows. It would be advisable to filter for unique values first in order to confirm that the results are what you want before you remove duplicate values.
- Fortunately, Excel comes with an in-built feature to remove duplicate values from a table. With it, you can remove the duplicate values from a given table based on selected columns.
Let’s understand by an example:
Step 1:
Follow these steps to remove duplicate values: Select data –> Go to Data ribbon –> Remove Duplicates
2. Removing Spaces:
- It is possible that the data you have in Excel may contain leading, trailing, or multiple embedded space characters. These characters can sometimes cause unexpected results when you sort, filter, or search.
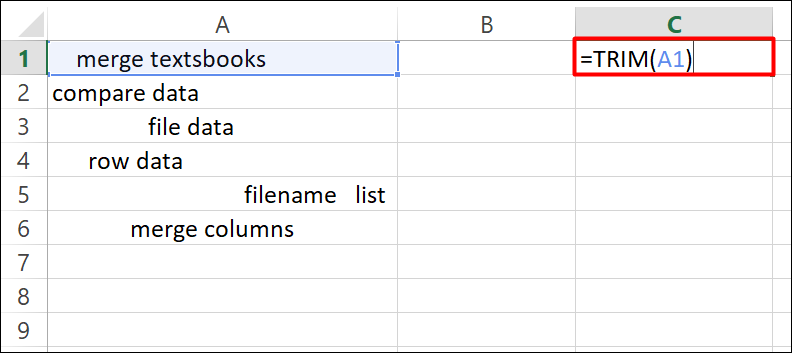
- However, you can use the Trim function in Microsoft Excel in order to remove all spaces from text except for single spaces between words.
Step 1:
Enter the formula =TRIM (A1) in the adjacent cell C1 and press the Enter key.
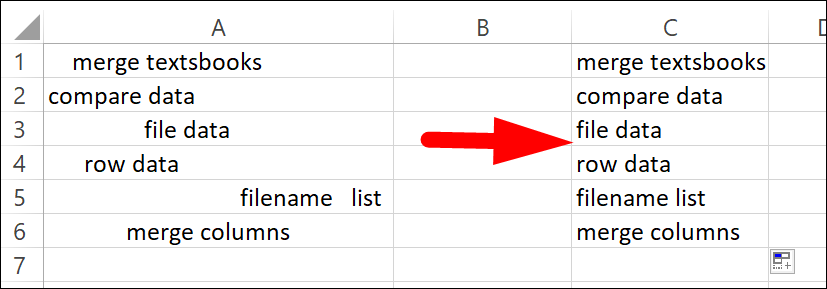
Step 2:
Select cell C1 and drag the fill handle down to the range cell that you want to remove the leading space. Then you can see all cell contents are extracted with all leading spaces removed. Please see the screenshot:
3. Merging and Splitting columns
- In Excel, it is common to merge or split two or more columns into one or split one column into two or more columns.
- For example, you may want to split a column that contains an address field into separate street, city, region, and postal code columns.
- For this task, we will make use of Table To Column Function.
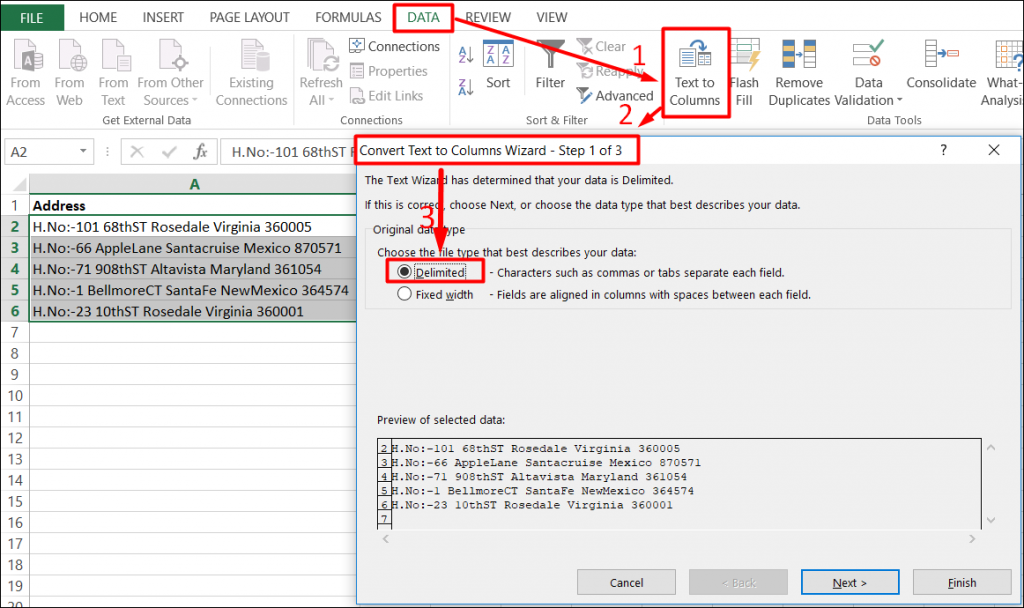
Step 1:
Go to Data tab, in Sort & Filter Group. Click on the Text to Columns.
Then choose radio button: Delimited (to split the address) and click on next button like the screenshot given below:
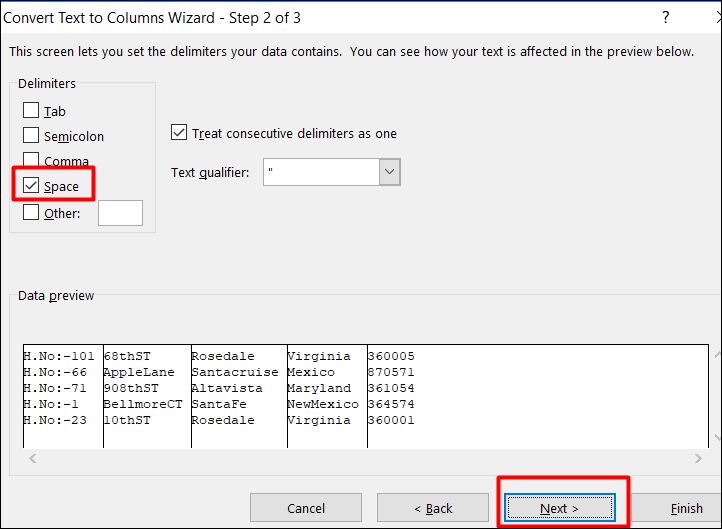
Step 2:
Click and put a tick on the “Space” check box because our data delimiter is “Space”. When you click on it, you will be able to see the data being separated in the data preview box.
Then Click on the Next button.
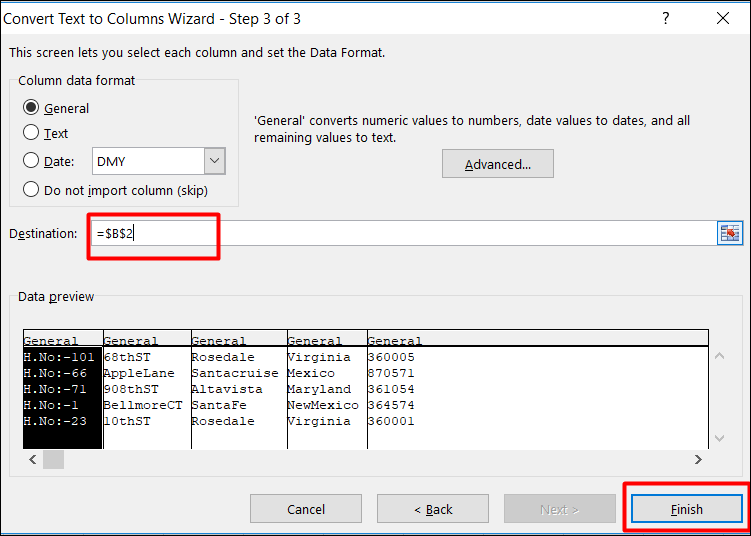
Step 3:
Click on destination to choose the location where you want to split the text and Click on the “Finish” button.
Step 4:
You can see that the text from one cell in column A has been split into the column B:F as shown below.
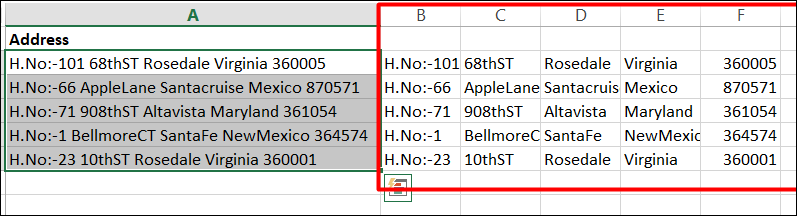
You can also use this feature for additional common values that may require merging into one column or splitting into multiple columns include product codes, file paths, and Internet Protocol (IP) addresses.
4. Reconciling table data by joining or matching
- Excel can also be used for finding and correcting matching errors when two or more tables are joined. This may entail reconciling two tables from different worksheets.
- For example, you can use it to see all records in both tables or to compare tables and find rows that don’t match.
- Here, function vlookup() would help to perform this task.
- Vlookup(): It searches for a value in the first column of a table array and returns a value in the same row from another column in the table array.
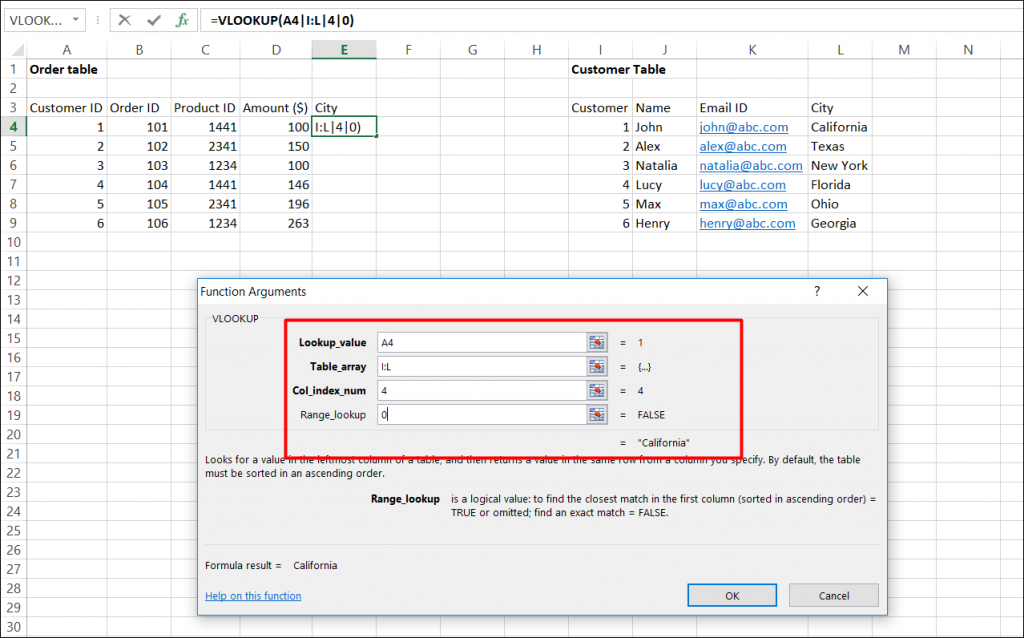
- Let’s look at the table below (order and Customer). In Order table, we want to map city name from the customer tables based on common key “Customer ID”.
- Here, function vlookup() will enable us to perform this task.
- Go to Formula tab -> in Function Library click on Lookup & Reference -> click on Vlookup.
- Now, We´ll use the VLOOKUP function and type this formula into E3.
- Vlookup Syntax:
- Lookup_value : Key to lookup
- Table_array : Source_table
- Col_index_num : column of source table
- Range_lookup : are you ok with relative match?
- For our example:
- Lookup_value – A4
- Table_array – I : L
- Col_index_num – 4
- Range_lookup – 0
- This will return the city name for all the Customer id 1 and post that copy this formula for all Customer ids. Please see the screenshot given below:
Data Exploration Using Pivot Table
- Data Exploring is the vital process of performing initial investigations on data in order to find out patterns, to spot anomalies, to test hypothesis and to check assumptions with the help of summary statistics and graphical representations.
- Why it matters so much is that you can make use of exploring data and make sense of the data you have. You can then figure out what questions you want to ask and how to frame them, as well as how best to manipulate your available data sources to get the answers you need.
Pivot Table:
- Excel’s Pivot Table is a summary table that lets you count, average, sum, and perform other calculations according to the reference feature you have selected.
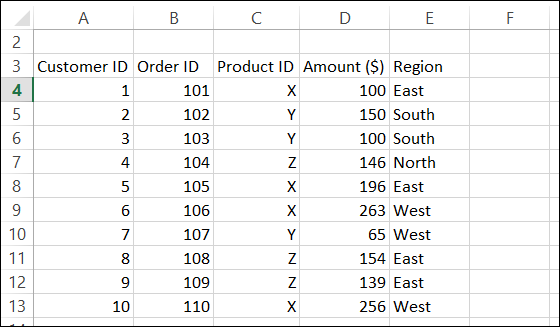
- Let’s Create Pivot Table for the table given below:
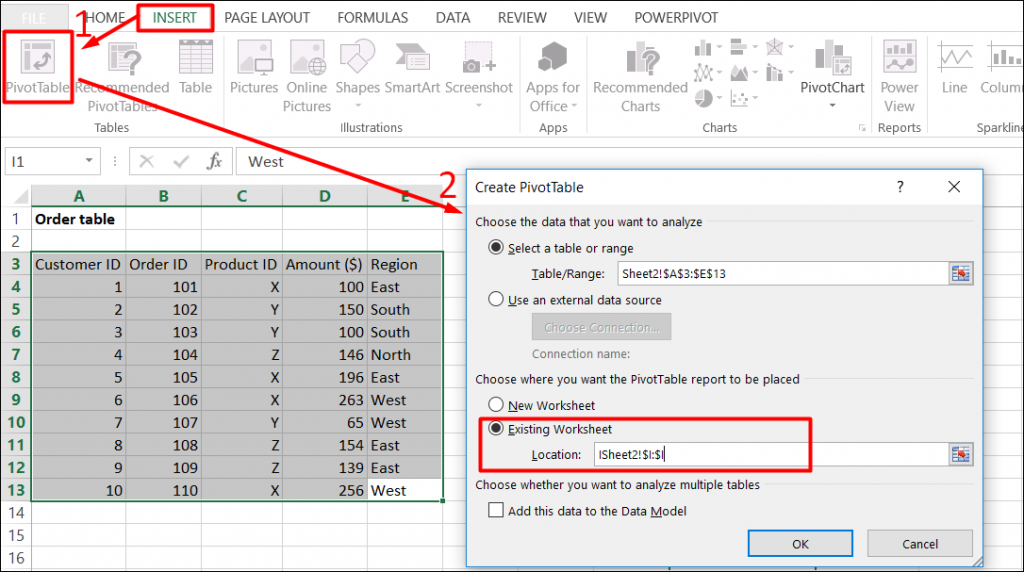
Step 1:
To show Region and Product wise sum of premium, we will create a pivot table as follows:
Select table (A3:E13) -> Go to Insert tab, in the tables group, Click on Pivot Table.
Then select Existing worksheet Location where you want the Pivot Table.
Step 2:
Now, you can see the Pivot Table Field List panel, which contains the fields from your list. All you need to do is to arrange them in the boxes at the foot of the panel. Once you have done that, the diagram on the left becomes your Pivot Table.
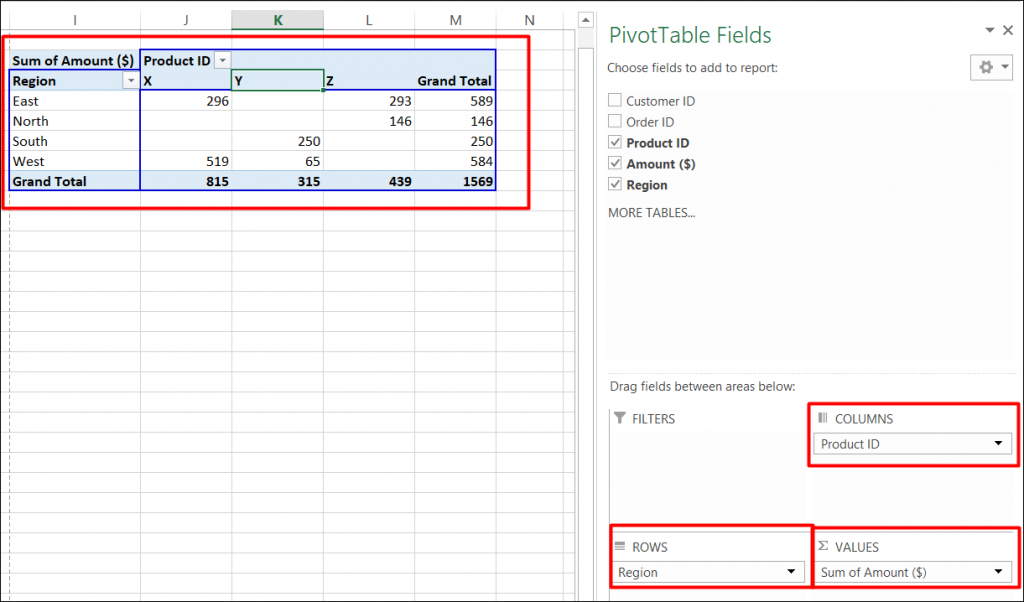
As shown in the screenshot, you can see that we have arranged “Region” in row, “Product id” in column and sum of “Premium” is taken as value. Now you are ready with pivot table which shows Region and Product wise sum of premium. You can also use count, average, min, max and other summary metric.
Data Visualization:
- As exploring data is quite important, data visualization as a technique through which we can explore data also becomes vital for us.
- Data visualization is the presentation of data in a pictorial or graphical format. The reason why such a graphical format matters is that it becomes easier for decision makers to see analytics presented visually. In other words, they can grasp difficult concepts or identify new patterns far more easily.
- In Excel, there are 2 features (Charts and Pivot Charts) which are most popular for data visualization.
Charts:
A simple chart in Excel can say a lot more than a sheet full of numbers. As you’ll see, creating charts is quite easy.
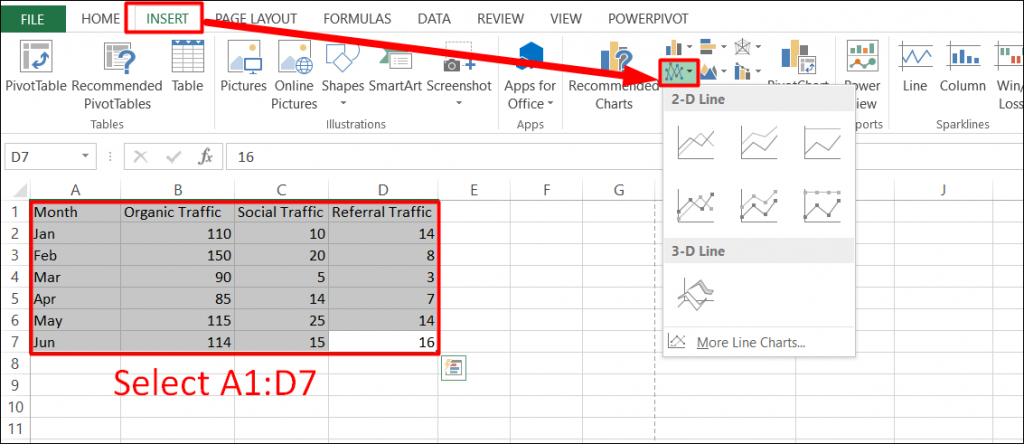
Let’s create Simple Line Chart by executing following steps:
Step 1:
Select the range A1:C11 -> On the Insert tab, in the Charts group, click the Line symbol.
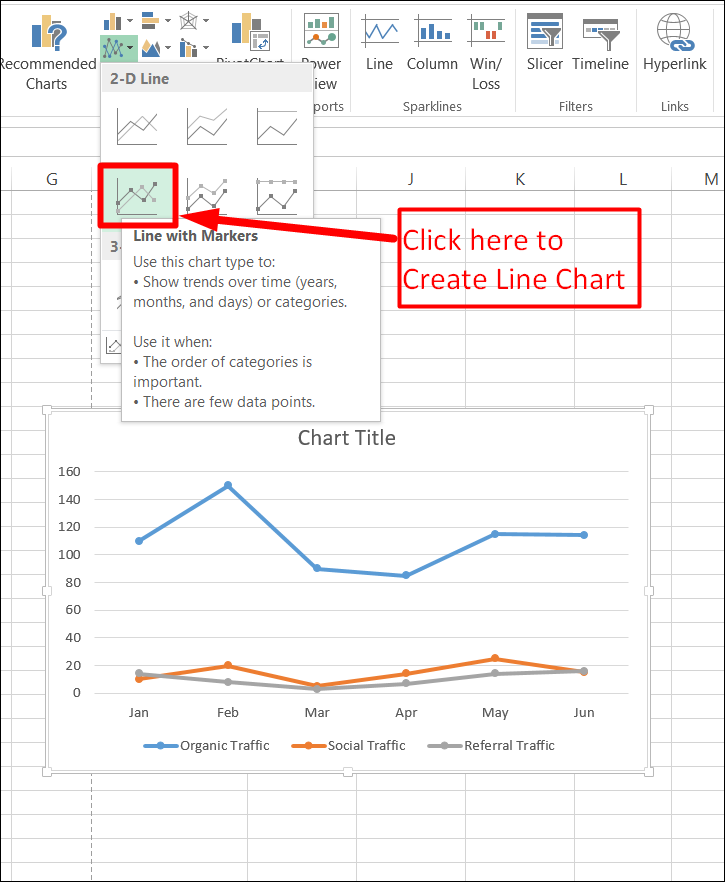
Step 2:
Now, to create Line Chart, click Line with Markers as shown in the screenshot.
Pivot chart:
A pivot chart is the visual representation of a pivot table in Excel. Pivot charts and pivot tables are connected with each other.
Go back to Pivot Tables to learn how to create this pivot table.
Let’s create a Pivot Chart:
Step 1:
Click any cell inside the pivot table -> On the Insert tab, in the Charts group, click Pivot Chart.
Then the Insert Chart dialog box appears. Click OK to create pivot Chart.
In the screenshot given below, you can find the pivot chart.
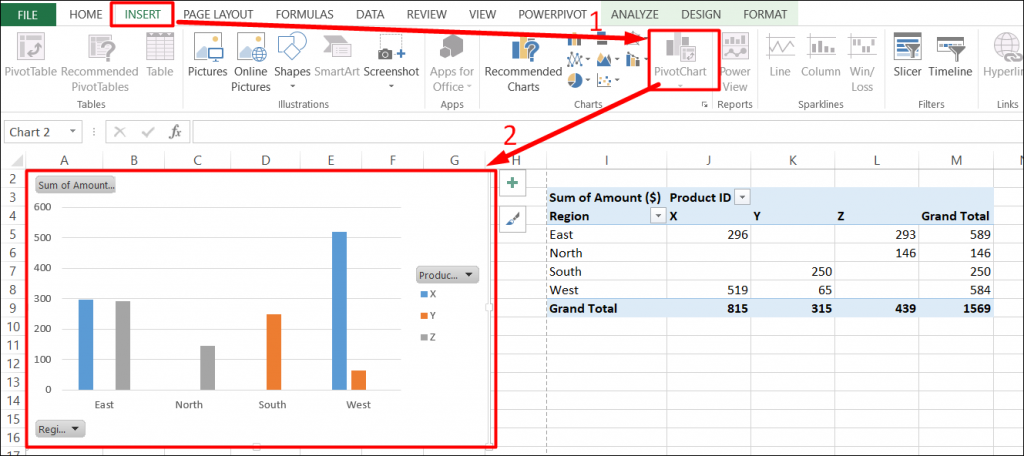
Once you have created the pivot chart, you can customize it to your particular needs to communicate your desired message by filtering chart attributes and changing chart types.
Advanced Tools and Add-ons:
1. PowerPivot
Excel has limitations of 1048576 Rows which means you cannot analyze more than 1048576 rows of data.
And this is where Powerpivot comes in…
Power Pivot is an Excel Add-on that was first introduced in Excel 2010, and gives you a chance to import, merge and prepare data from more data sources at once.
You can import many tables from many different sources (SQL, Azure, Oracle, Excel, Access,…) into Power Pivot and then you can relate all this data to one another.
It means that you can build a Data Model containing multiple data sets from multiple different sources and by connecting them acquiring the ability to analyze them all in one Pivot Table.
Learn More about Power Pivot :
https://support.office.com/en-us/article/power-pivot-powerful-data-analysis-and-data-modeling-in-excel-a9c2c6e2-cc49-4976-a7d7-40896795d045
2. ToolPak
While developing complex statistical or engineering analyses, you can save steps and time by using the Analysis ToolPak.
All you need to do is to provide the data and parameters for each analysis, and the tool uses the appropriate statistical or engineering macro functions to calculate and display the results in an output table. Some tools generate charts in addition to output tables.
ToolPak Provides 19 various features (like Correlation, Covariance, Histogram, Regression and many more…) for data analysis.
Learn More about ToolPak:
https://support.office.com/en-us/article/use-the-analysis-toolpak-to-perform-complex-data-analysis-6c67ccf0-f4a9-487c-8dec-bdb5a2cefab6

End Note
It’s common knowledge how Excel is imperative for businesses in their day-to-day operations. However, not many businesses are aware of the potential of Excel for data analysis.
Since data analysis is crucial for businesses, it’s paramount that businesses leverage the power of Excel for data analysis. The more effectively you can use Excel, the more insights you can gain out of data analysis which you can utilize in enhancing your business.
There are other options such as Python, R Language or rapidminer that you can capitalize upon for data analysis as well. There are many tools that you can use for data analysis. However, each one will require a particular kind of expertise that you may or may not have. Therefore, data analysis with Excel is the simplest and yet one of the most effective data analysis solutions.
Do share your valuable feedback and comments regarding this blog.